
Data Science allows capturing and analyzing massive amounts of data derived from manufacturing processes. With Data Analytics Courses, businesses can examine vast amounts of graphical, temporal, and geospatial data. Analytics Certificate Online is widely useful in the finance and banking industries to detect fraud and individual financial advice.
Hypothesis testing refers to a statistical method of technique that allows scientists and researchers to test the validity of their searches and claims related to the real world and life events. This approach of testing is used in data science to analyze whether the results of the research are true or not. The knowledge of the concept of hypothesis formulation is the key for solving business and real-life problems using data science.
Hypothesis testing is used when we compare:
- a single group of data with an external standard
- two or more groups of data with each other
Steps of Hypothesis Testing
There are five steps to hypothesis testing as discussed below:
State the alternate hypothesis, H1, and null hypothesis, H0. The null hypothesis presents the statement for the population parameter. The alternate hypothesis is a statement that will be accepted when the null hypothesis proves to be invalid. The statement states that there are differences between the data parameters.
The Z test is a statistical hypothesis that is used to determine whether the calculated means of two samples are different when the standard deviation is known and the sample size is large.
The T test is used to determine how averages of various datasets differ from each other when the standard deviation or variance is unknown.
A p value is useful to reject or support the findings of the null hypothesis. The p value acts as evidence against a null hypothesis.
Specify the Level of Significance:
The levels of significance indicate the probability of making a Type I error which is a decision in favour of the alternate hypothesis when there are elements of truth in the null hypothesis. For instance, when the level of significance is 0.05, then there is a 5% chance of rejecting the true null hypothesis.
Collect data and calculate the value of the test statistic:
Z-statistic or t-statistic is used when testing for the hypothesis. The z-statistic method is usually employed when the standard deviation of the data is known or when there is a normal distribution of data or when the sample size is less than 30. The t-statistic method will be employed when the standard deviation of a data is unknown, or the data is normally distributed or when the sample size is greater than 30.
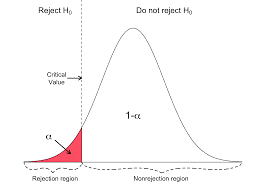
Find the critical values:
This is the value that distinguishes the rejected and non-rejection regions. This is obtained by using the level of significance by comparing the critical values to the test statistic values. The null hypothesis is rejected if computed values are within the rejected area.
Interpret the decision:
Using the results obtained in step 4, we decide whether to reject or fail to reject the null hypothesis. The decision is to be in support or against the null hypothesis.
For making conclusions using the p-values and the level of significance, when the level of significance obtained is less than the p-value, we fail to reject the null hypothesis. Still, when the significance level is higher than the p-value, we reject the null hypothesis.
Power is the probability of rejecting the false null hypothesis. Power should always be considered when designing an experiment. The sample size represents the total data items in an experiment.
Types of Hypothesis tests
There are 5 types of Hypothesis tests:
- Alternative Hypothesis
- Null Hypothesis
- Non-Directional Hypothesis
- Directional Hypothesis
- Statistical Hypothesis
You can learn more about these tests through an Online Data Science Degree.
Examples
Example 1
The typical sales for this quarter, according to one company, are 100 units. A simple hypothesis looks like this.
Let’s say the corporation reports that sales are between 90 and 100 units. Then you’re dealing with the concept of composite theory.
Example 2
Assume H0 is equal to 40 and H1 is not equal to 40.
The mean can be larger than or less than 40, according to the H1. A two-tailed test is demonstrated here.
Similarly, if H0: mean >=40, then H1: mean 40 is true.
The average is less than 40 in this case. It’s known as a one-tailed test.
Conclusion
With plenty of data and information from different fields, there’s no limit for data scientists when it comes to scope. But before this, one needs to get into the best Data Science Courses to polish and gain knowledge in the field. SkilloVilla is the best platform to learn about Data Analysis, Data Science, and Machine Learning. The platform comes with an opportunity for the students to help them get placed in their dream company and dream position.
Visit www.skillovilla.com if you want to learn more about the Data Science Full Course offered.